Scenarios

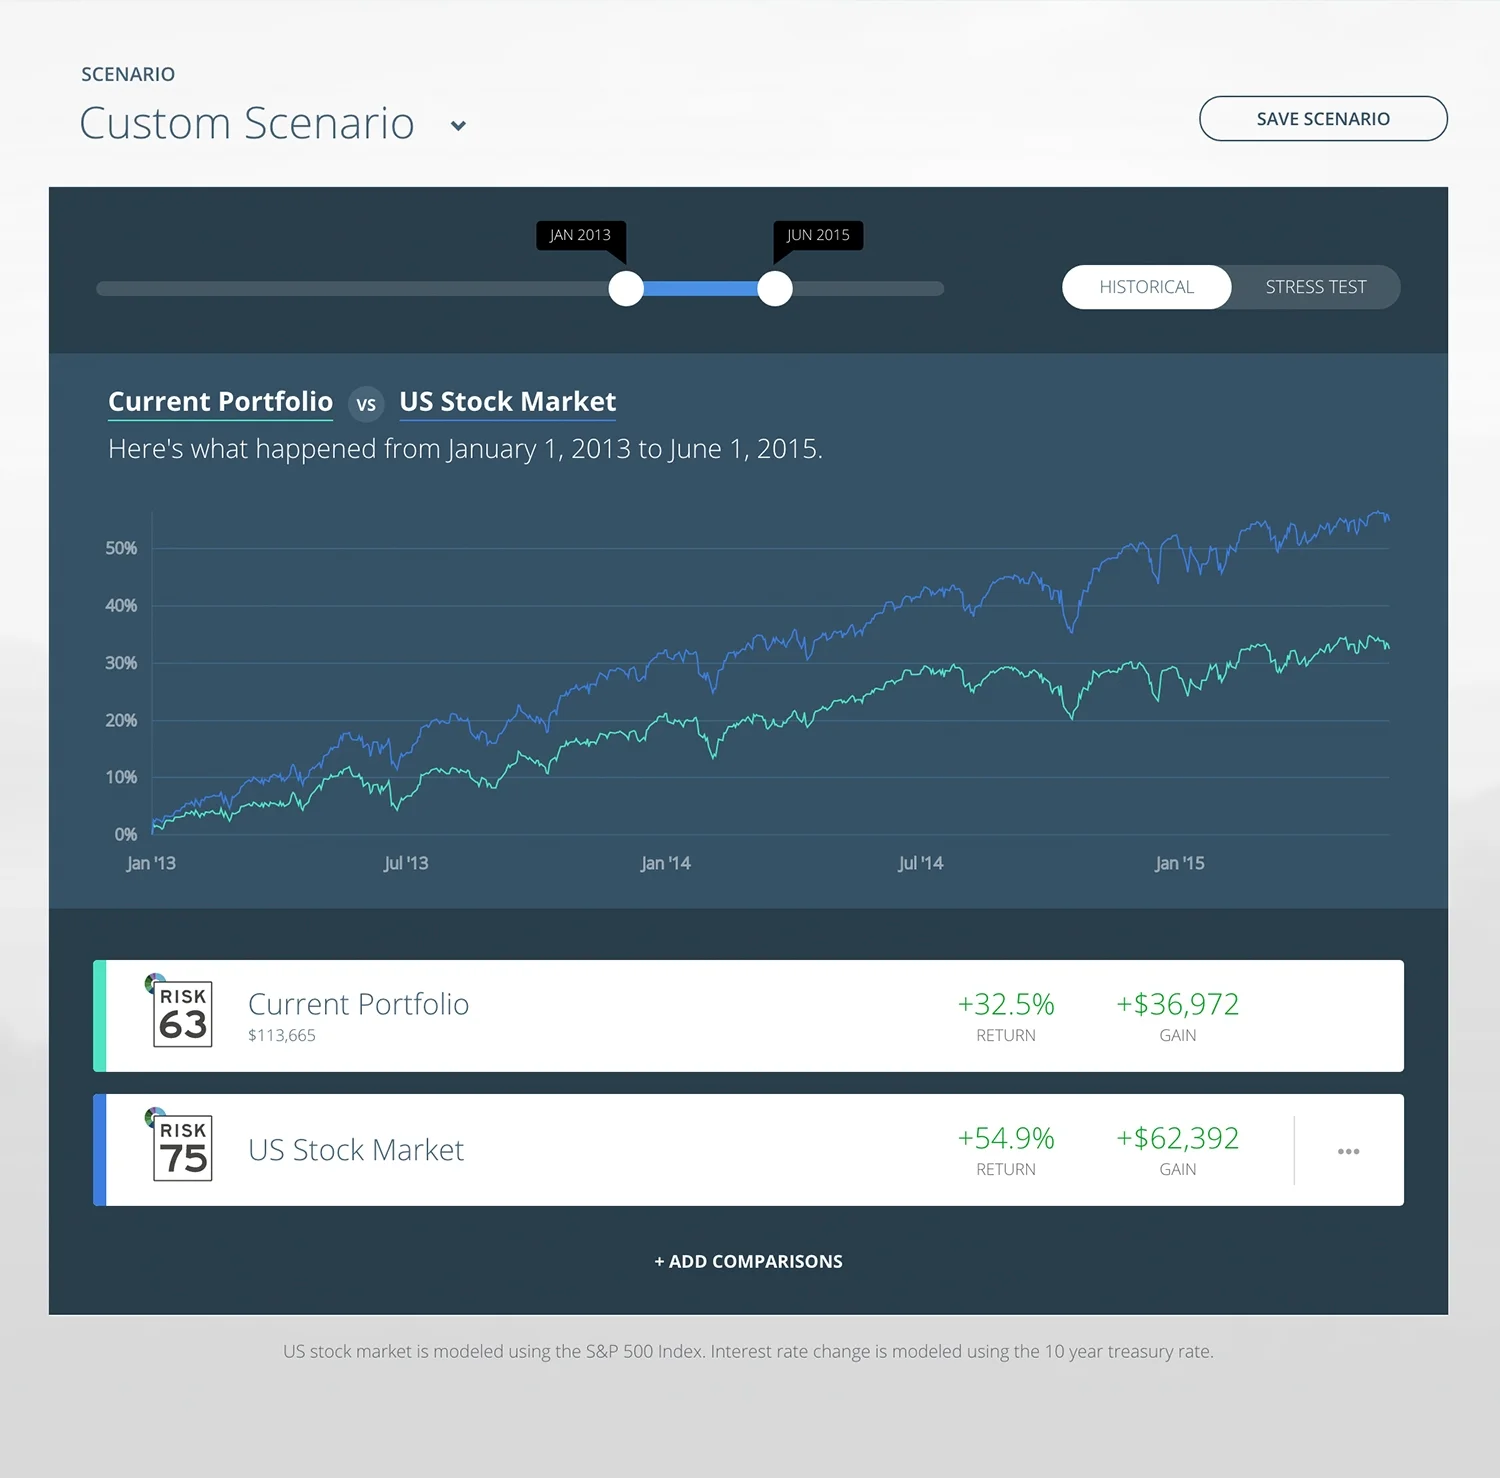
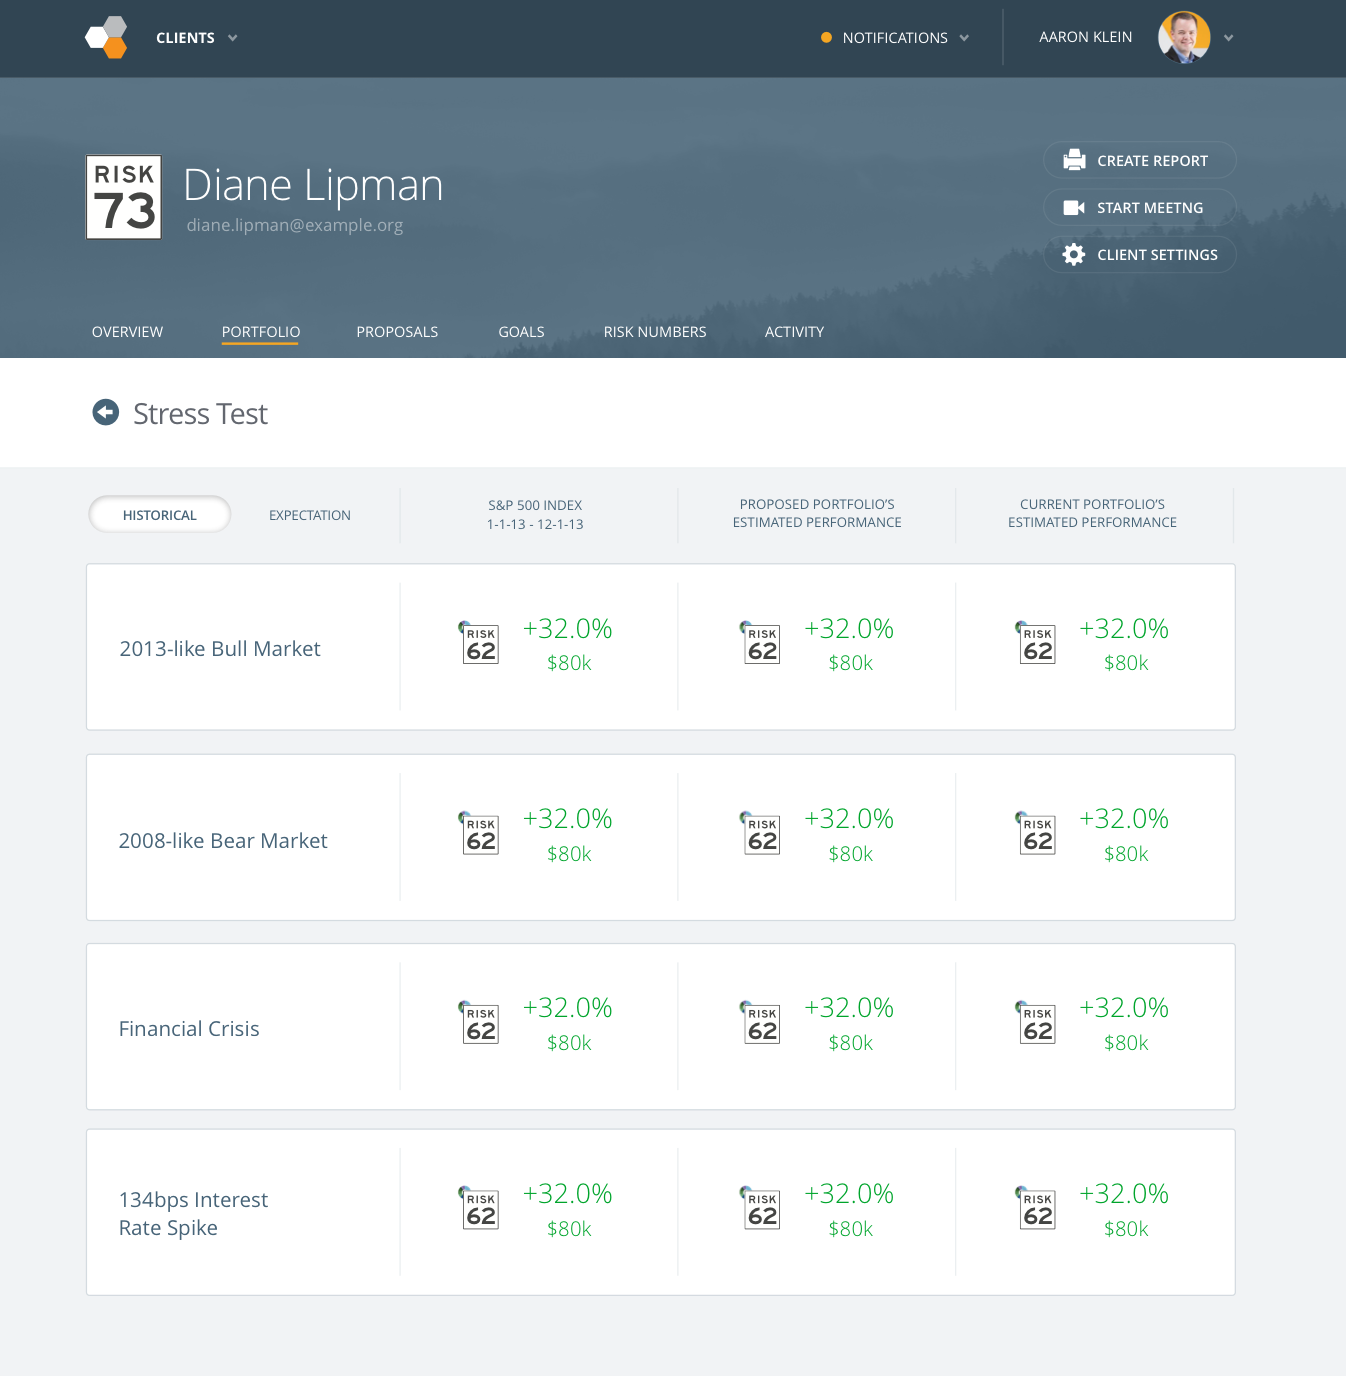
With Scenarios, advisors can run any of their client’s portfolios through a market timeline, and compare them to just the right benchmark to make their point. They have always been able to demonstrate in the product how a client's portfolio would have performed during specific market events, but now they can string these events together to create a portfolio narrative that settles the question once and for all... "Why is the market beating my portfolio?"
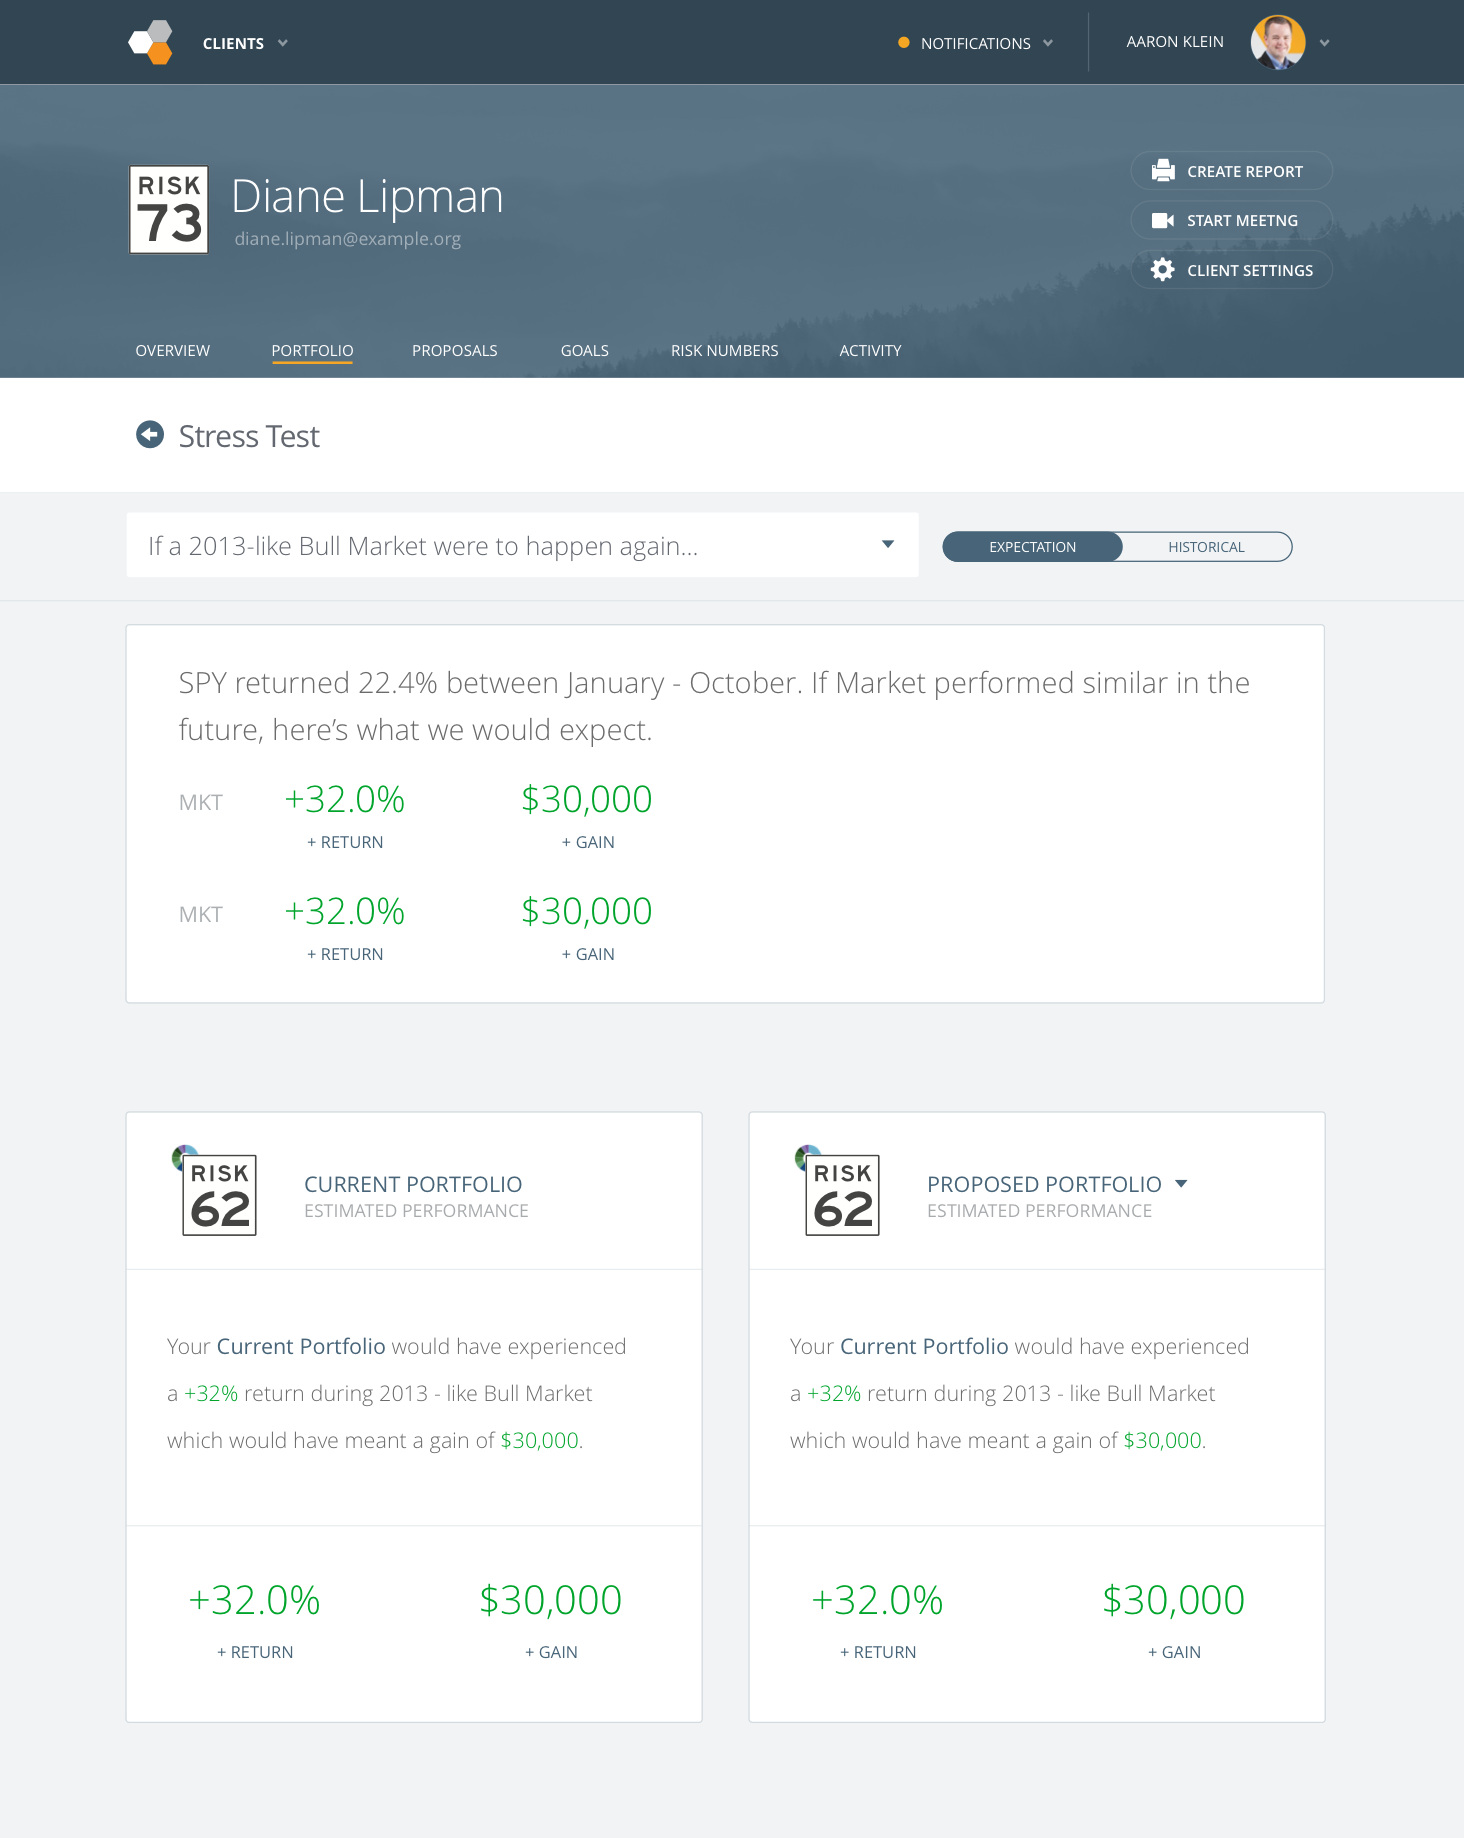
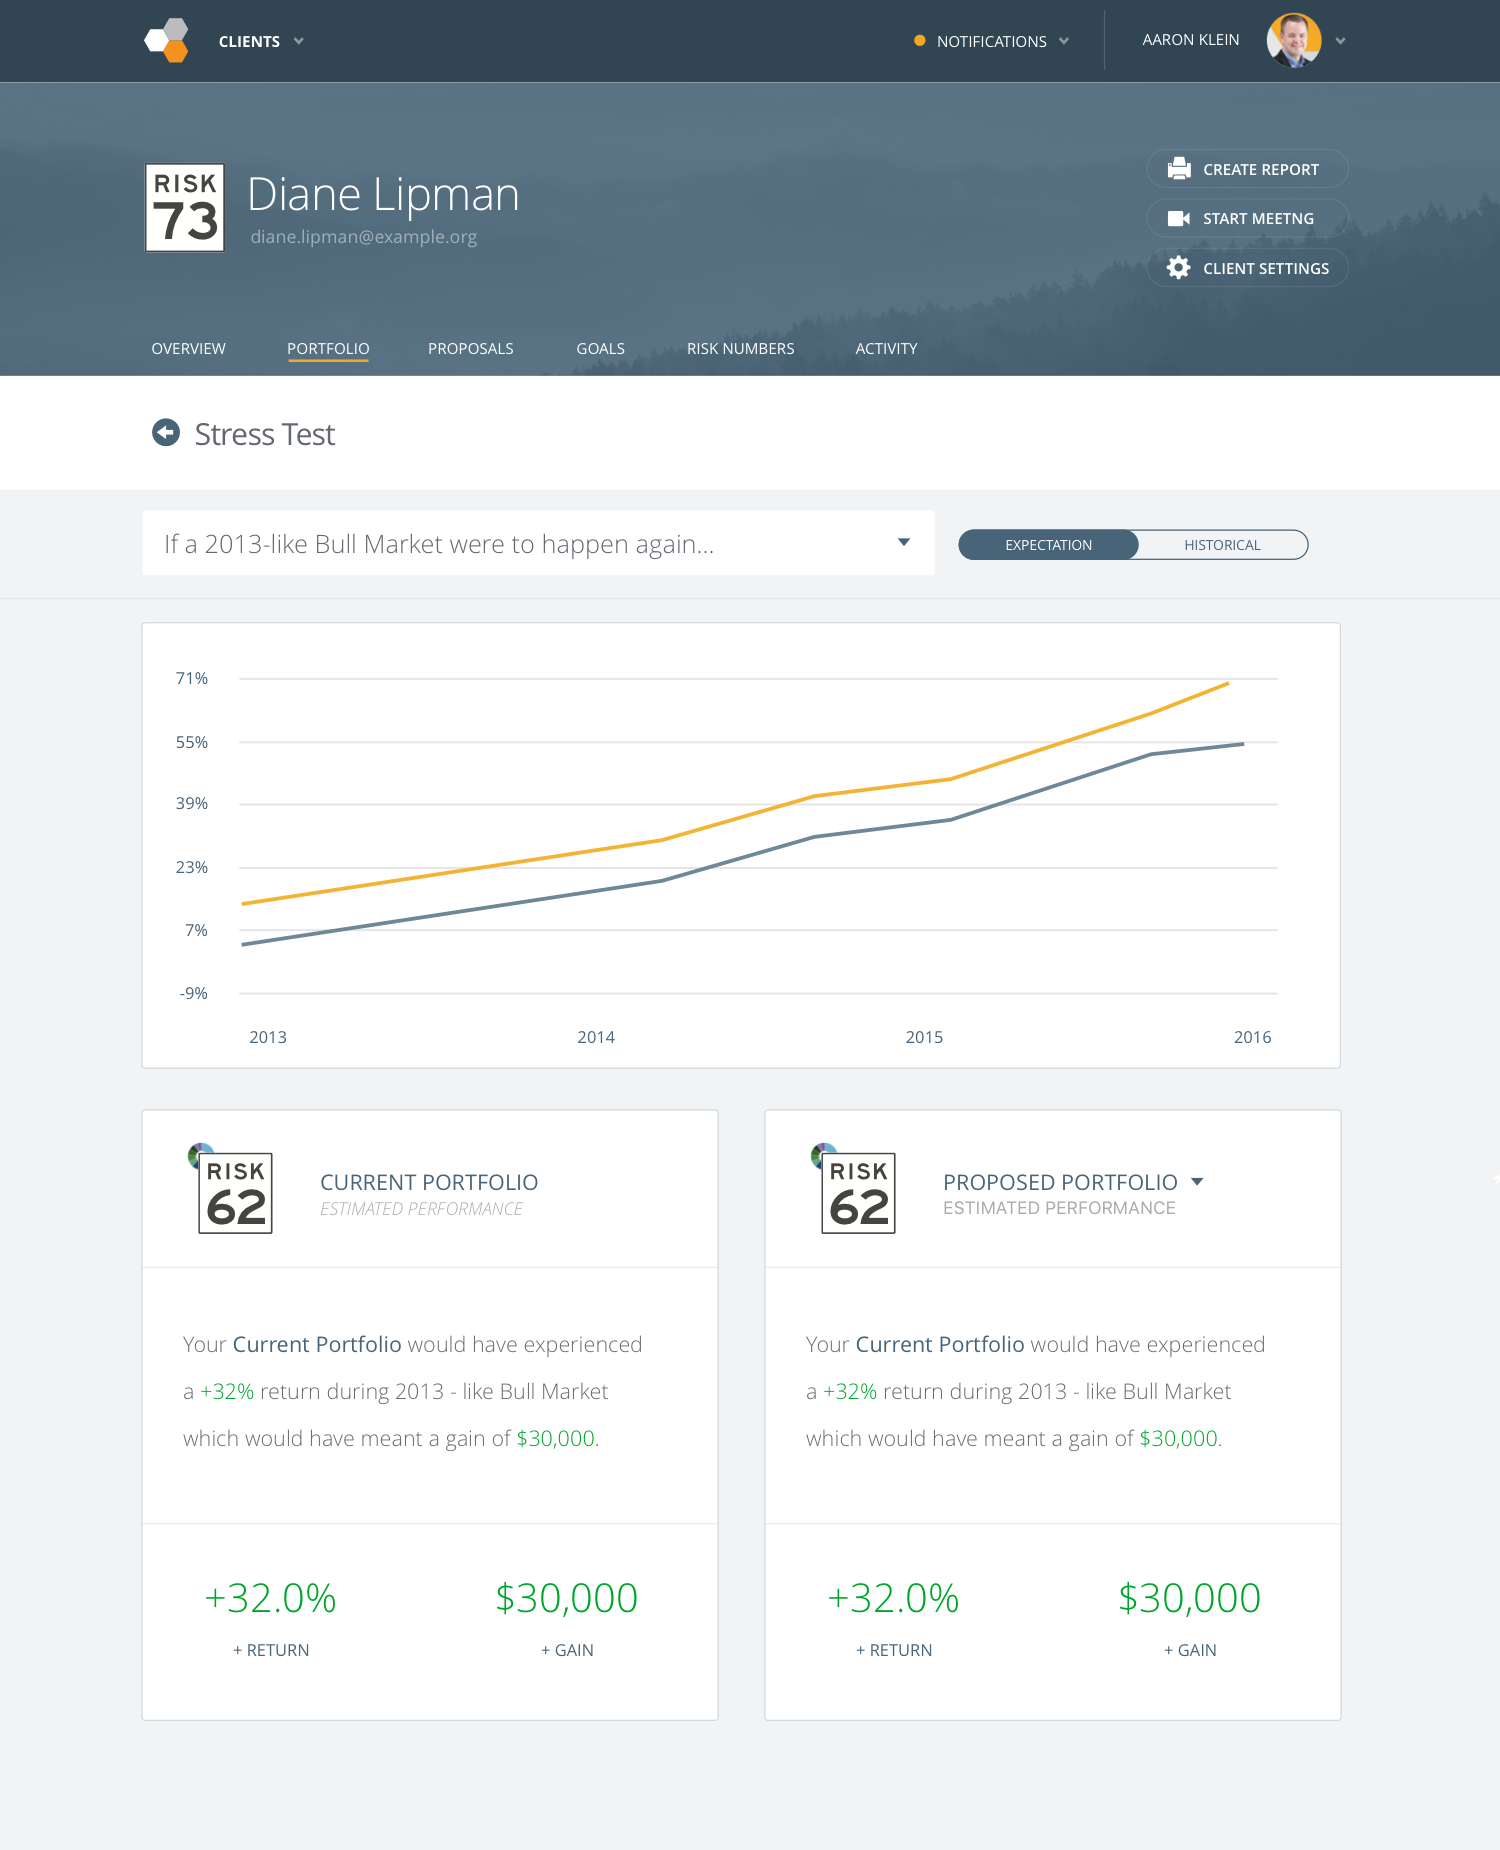
Scenarios empowers advsiors to set far better client expectations. For example, seeing how a portfolio would have performed in the 2013 Bull Market is a great stress test, but it doesn't tell the whole story. With Scenarios, you can now show the two bear markets a portfolio had to go through before reaching the gains of 2013, and display those findings to clients beautifully in Riskalyze.
Scenarios also allows advisors to save a variety of different contexts they would like to highlight for clients and compare them to the suggestions, Risk Number models, and custom market events.
Prototype: https://invis.io/XJHPHW1BEV6#/294215708_1e
Exploration
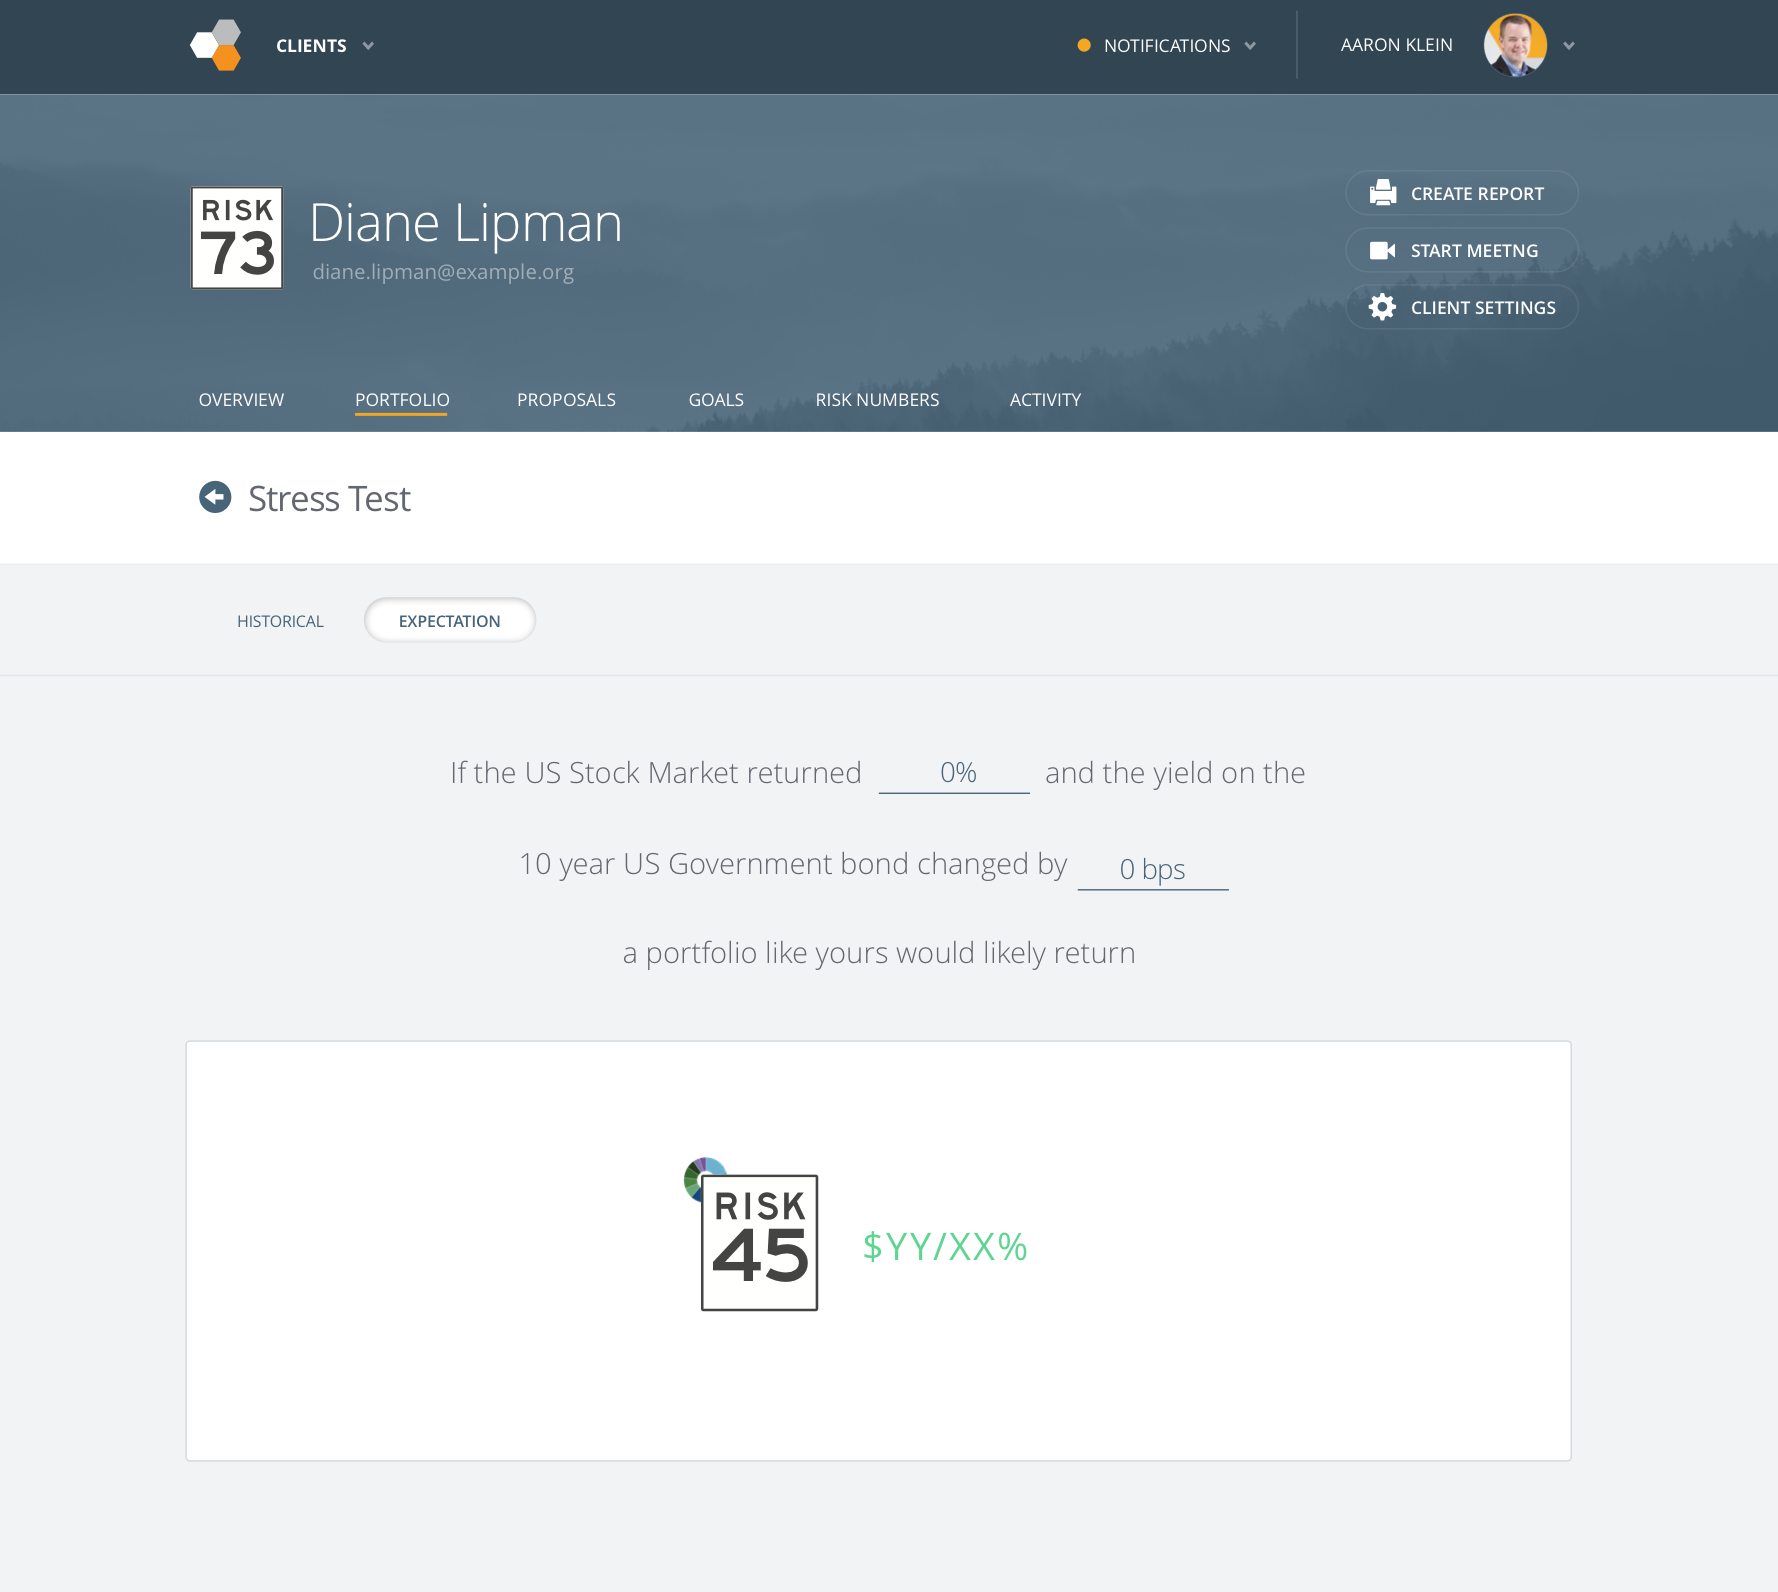
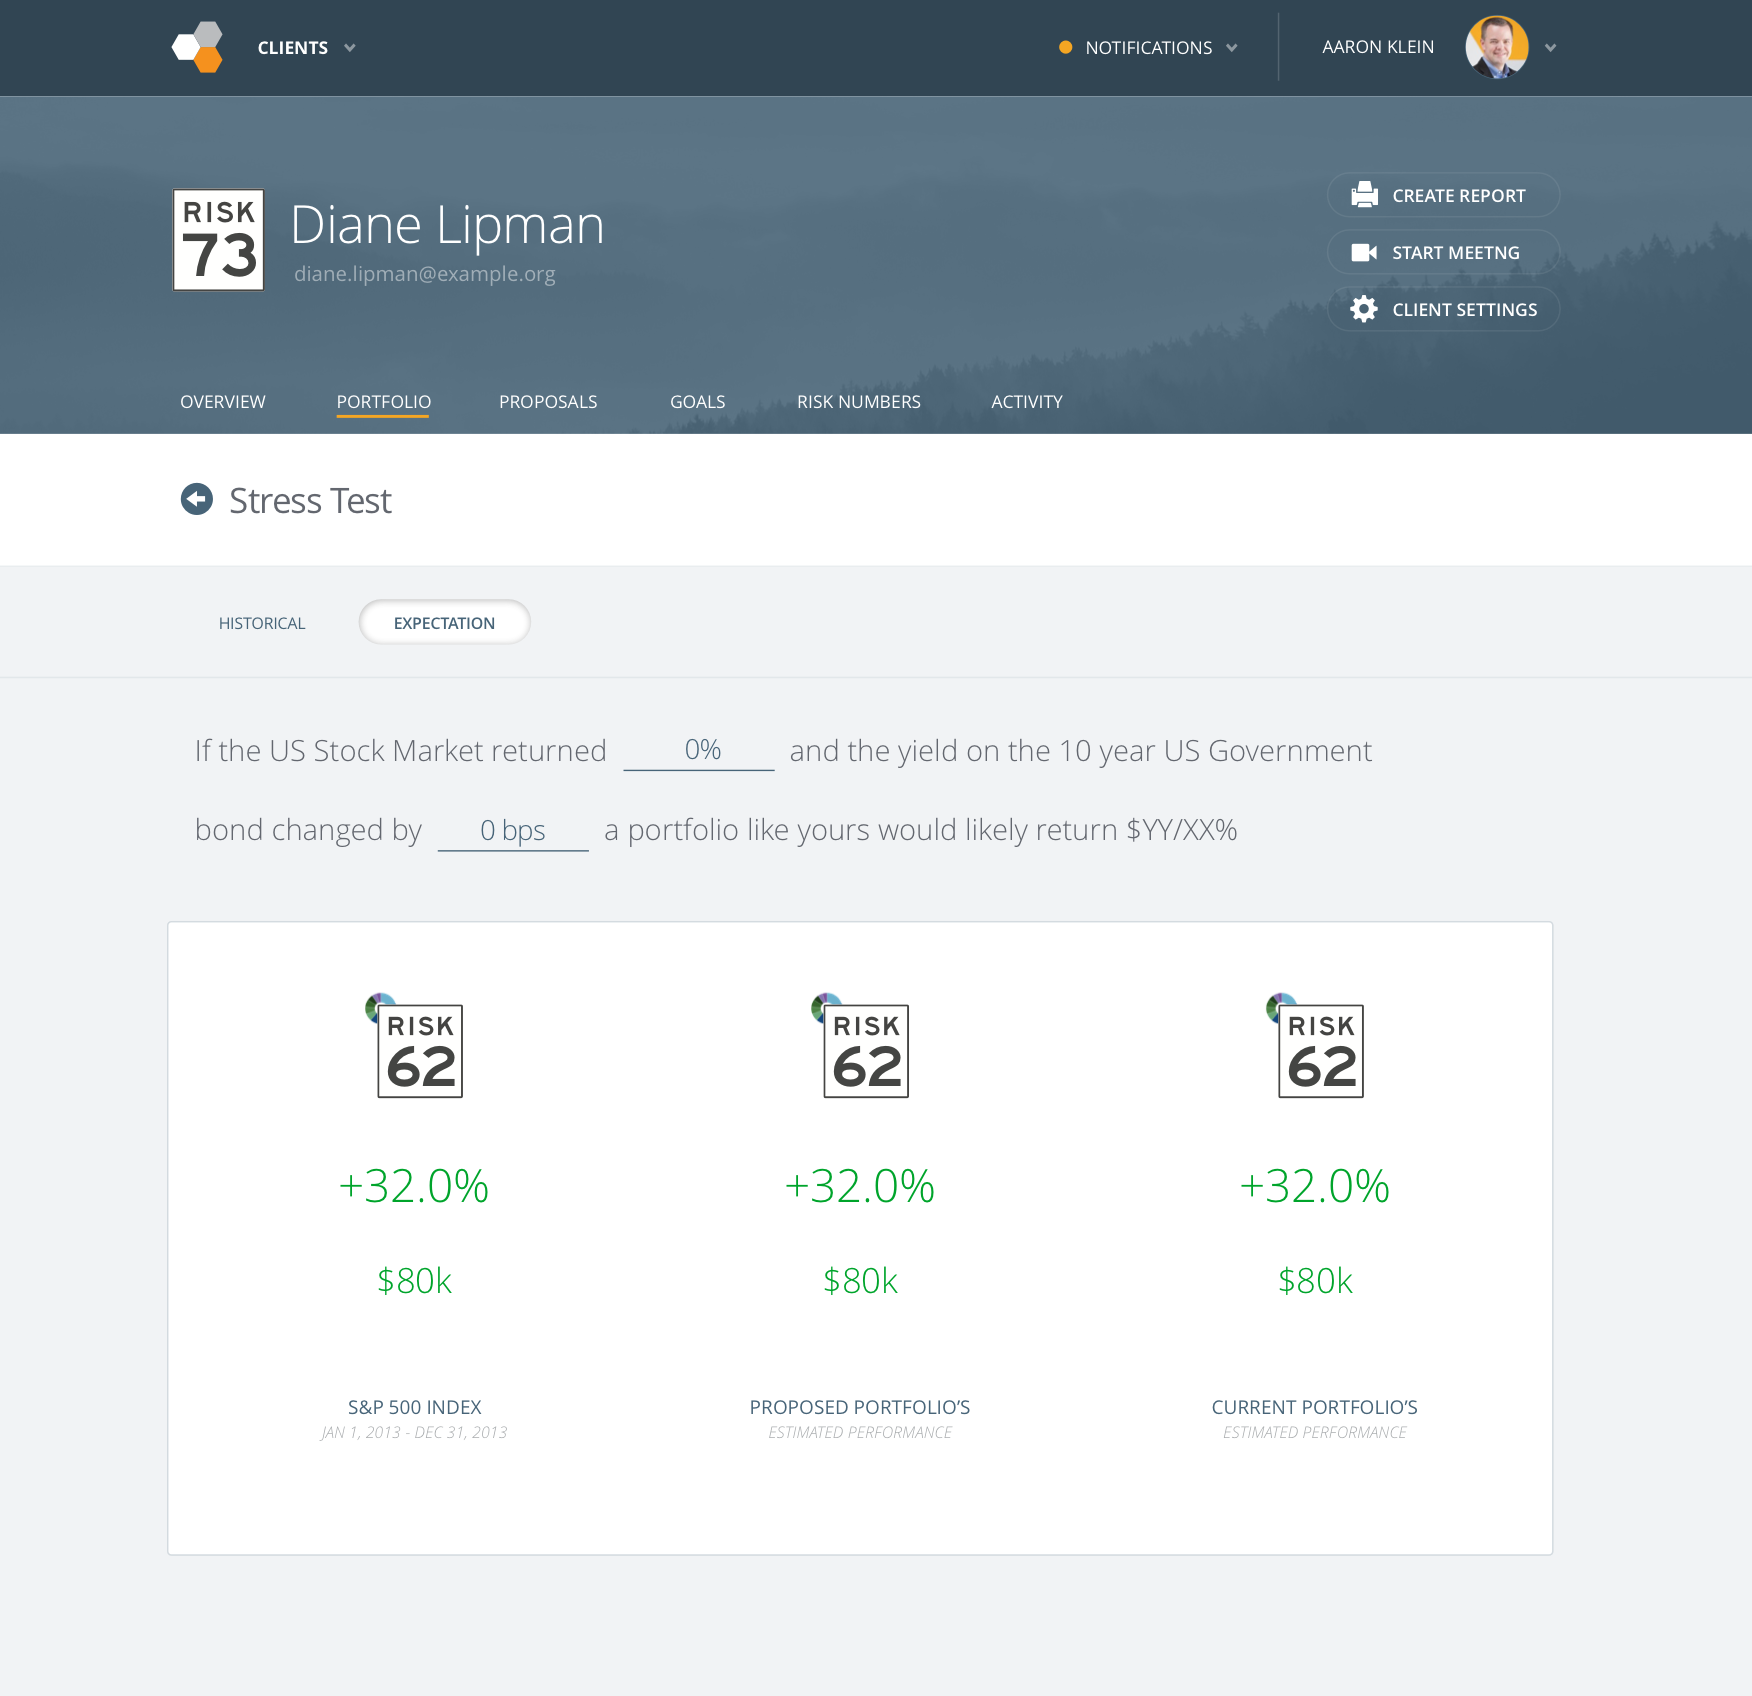
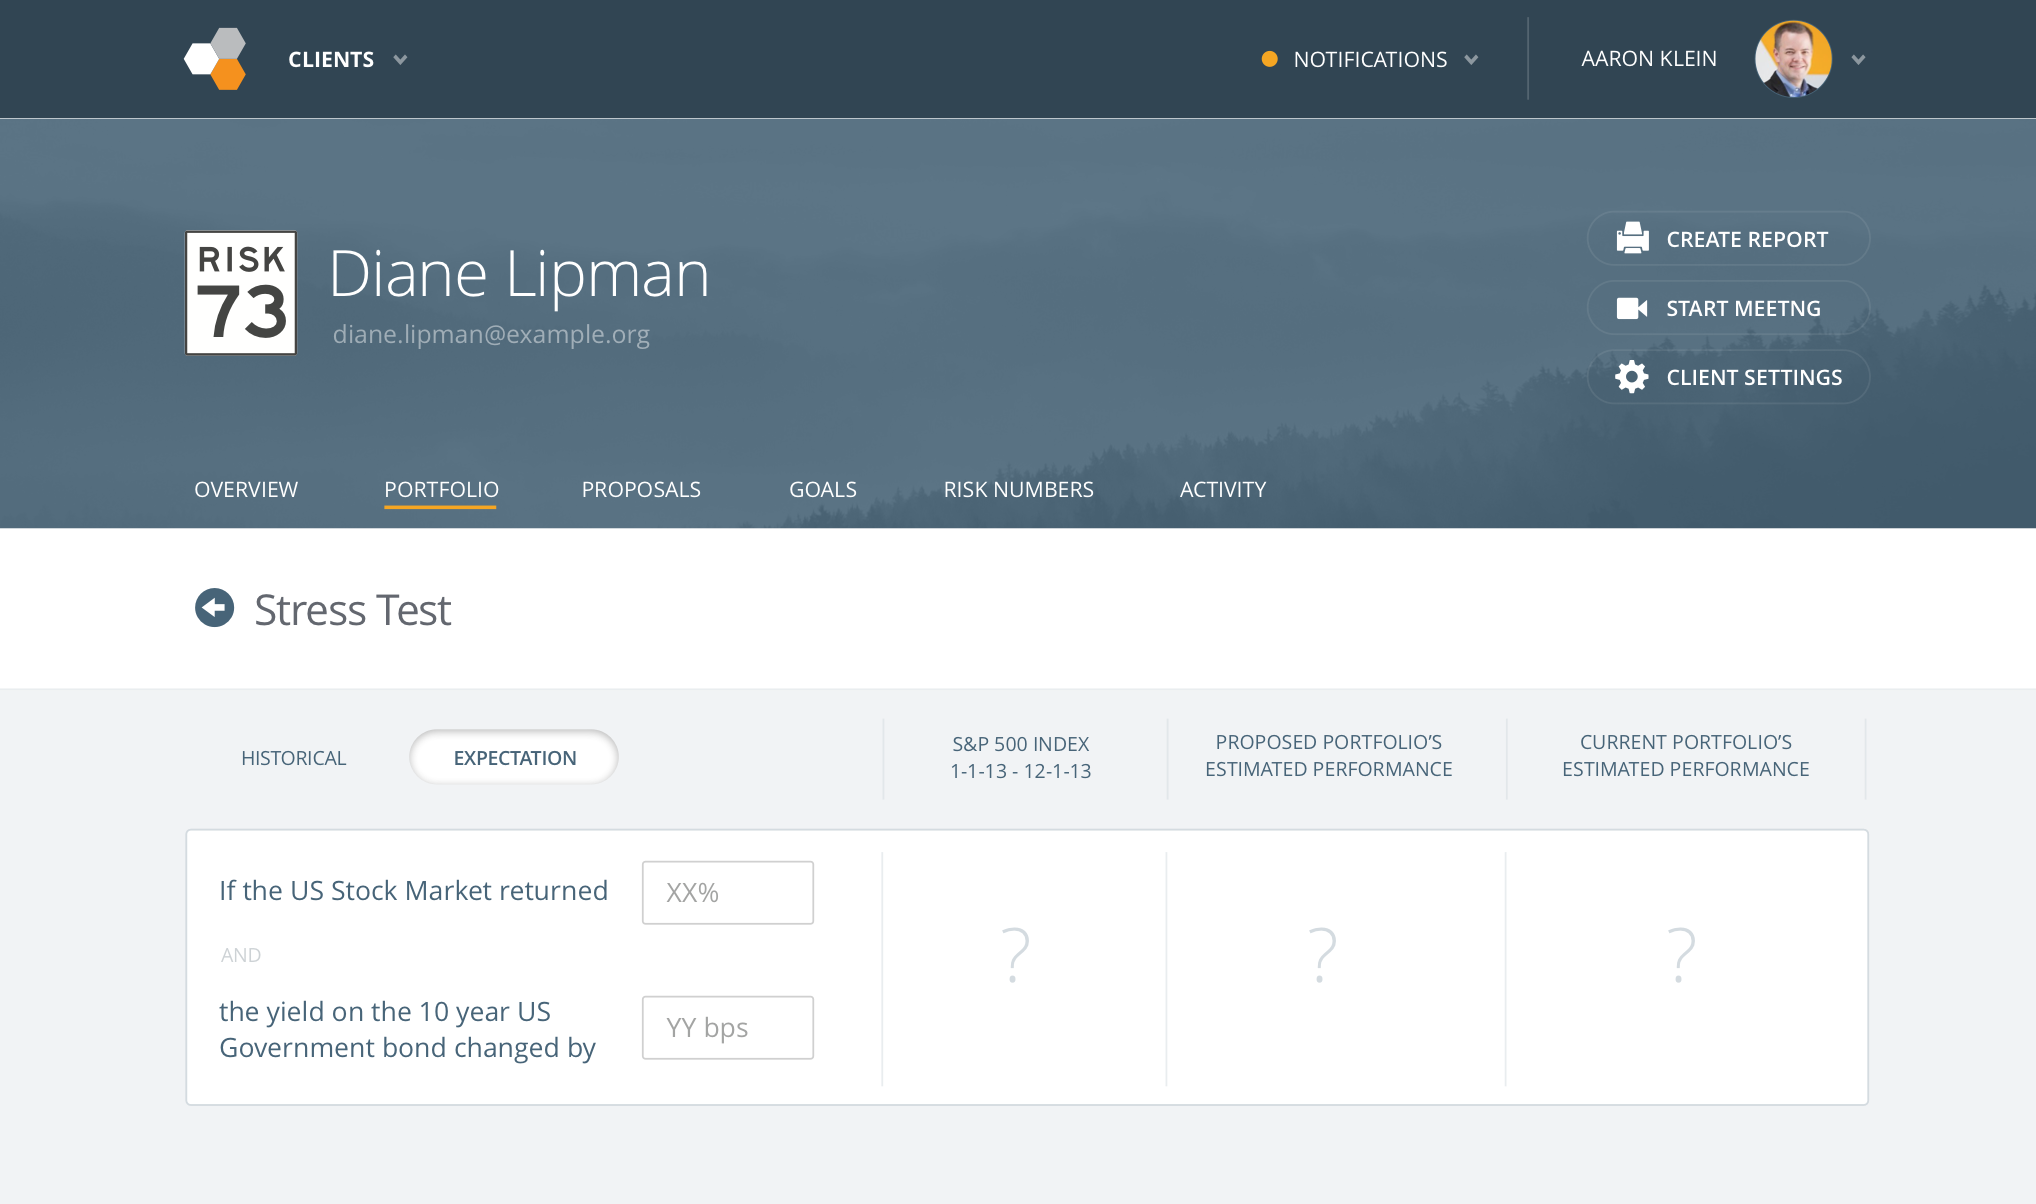
On a team of one at the times wireframing and rough mocks merge and become really ugly mocks for time saving sake. I had the container the new feature would be living in so I used that and designed around those elements very loosely. Below is a sample of the rough wireframe/mocks and iterations that went into the final design for scenarios.
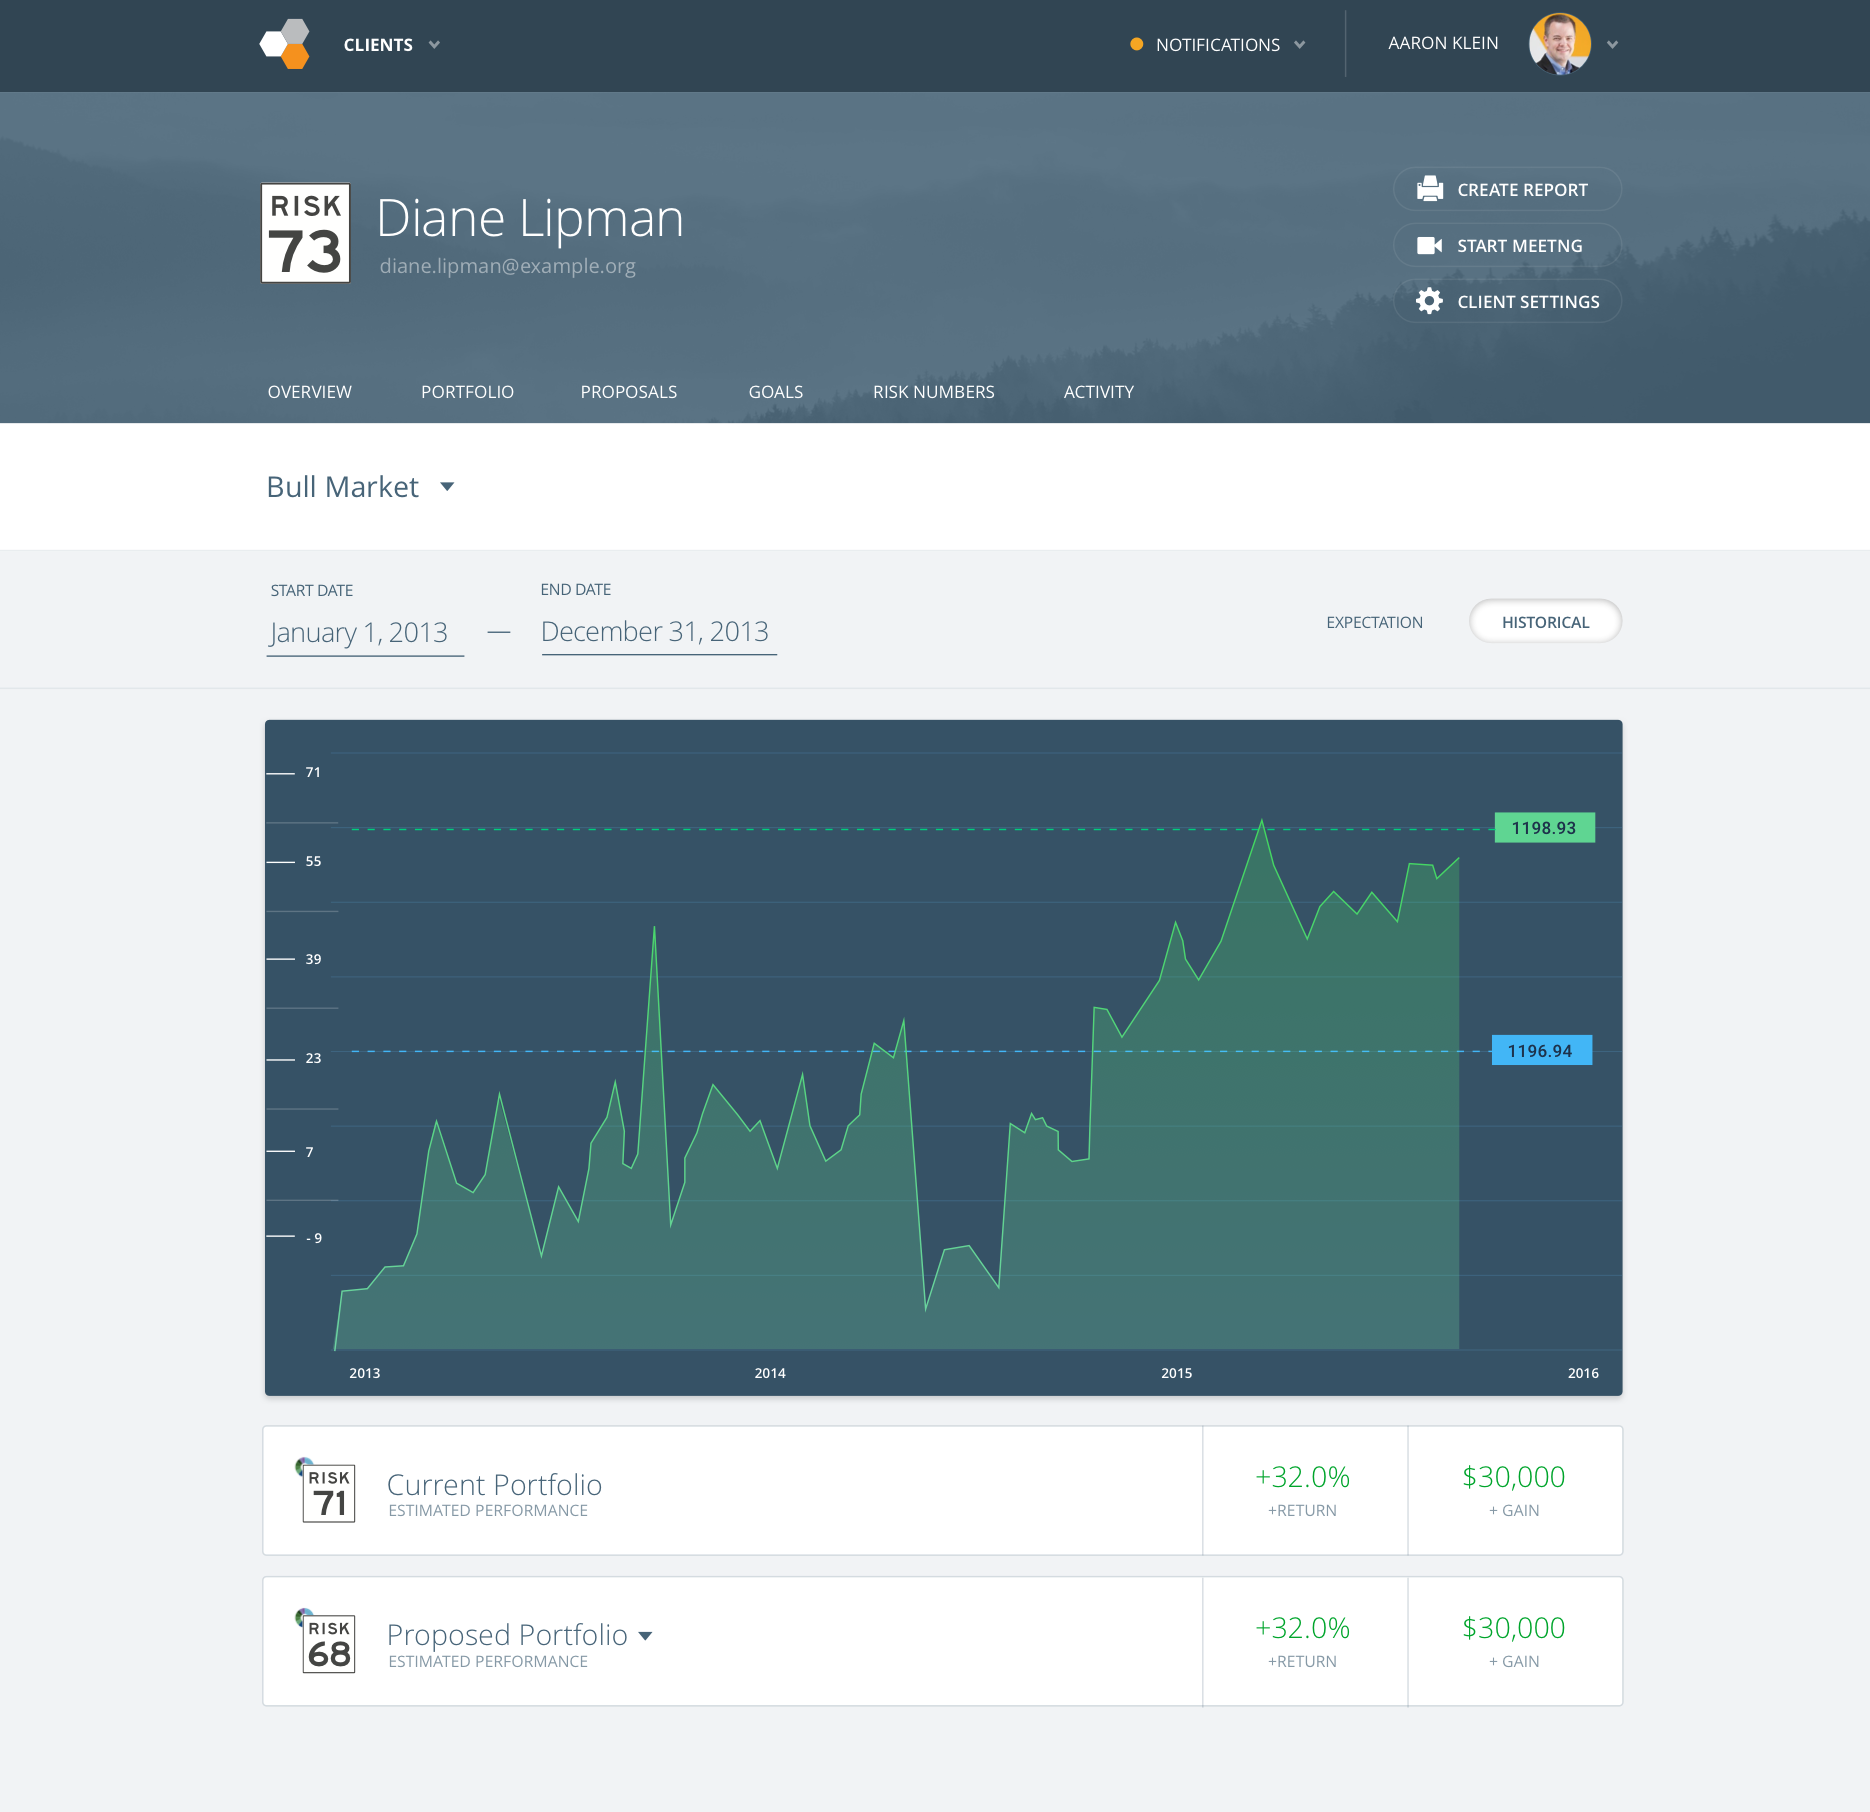


Final Design
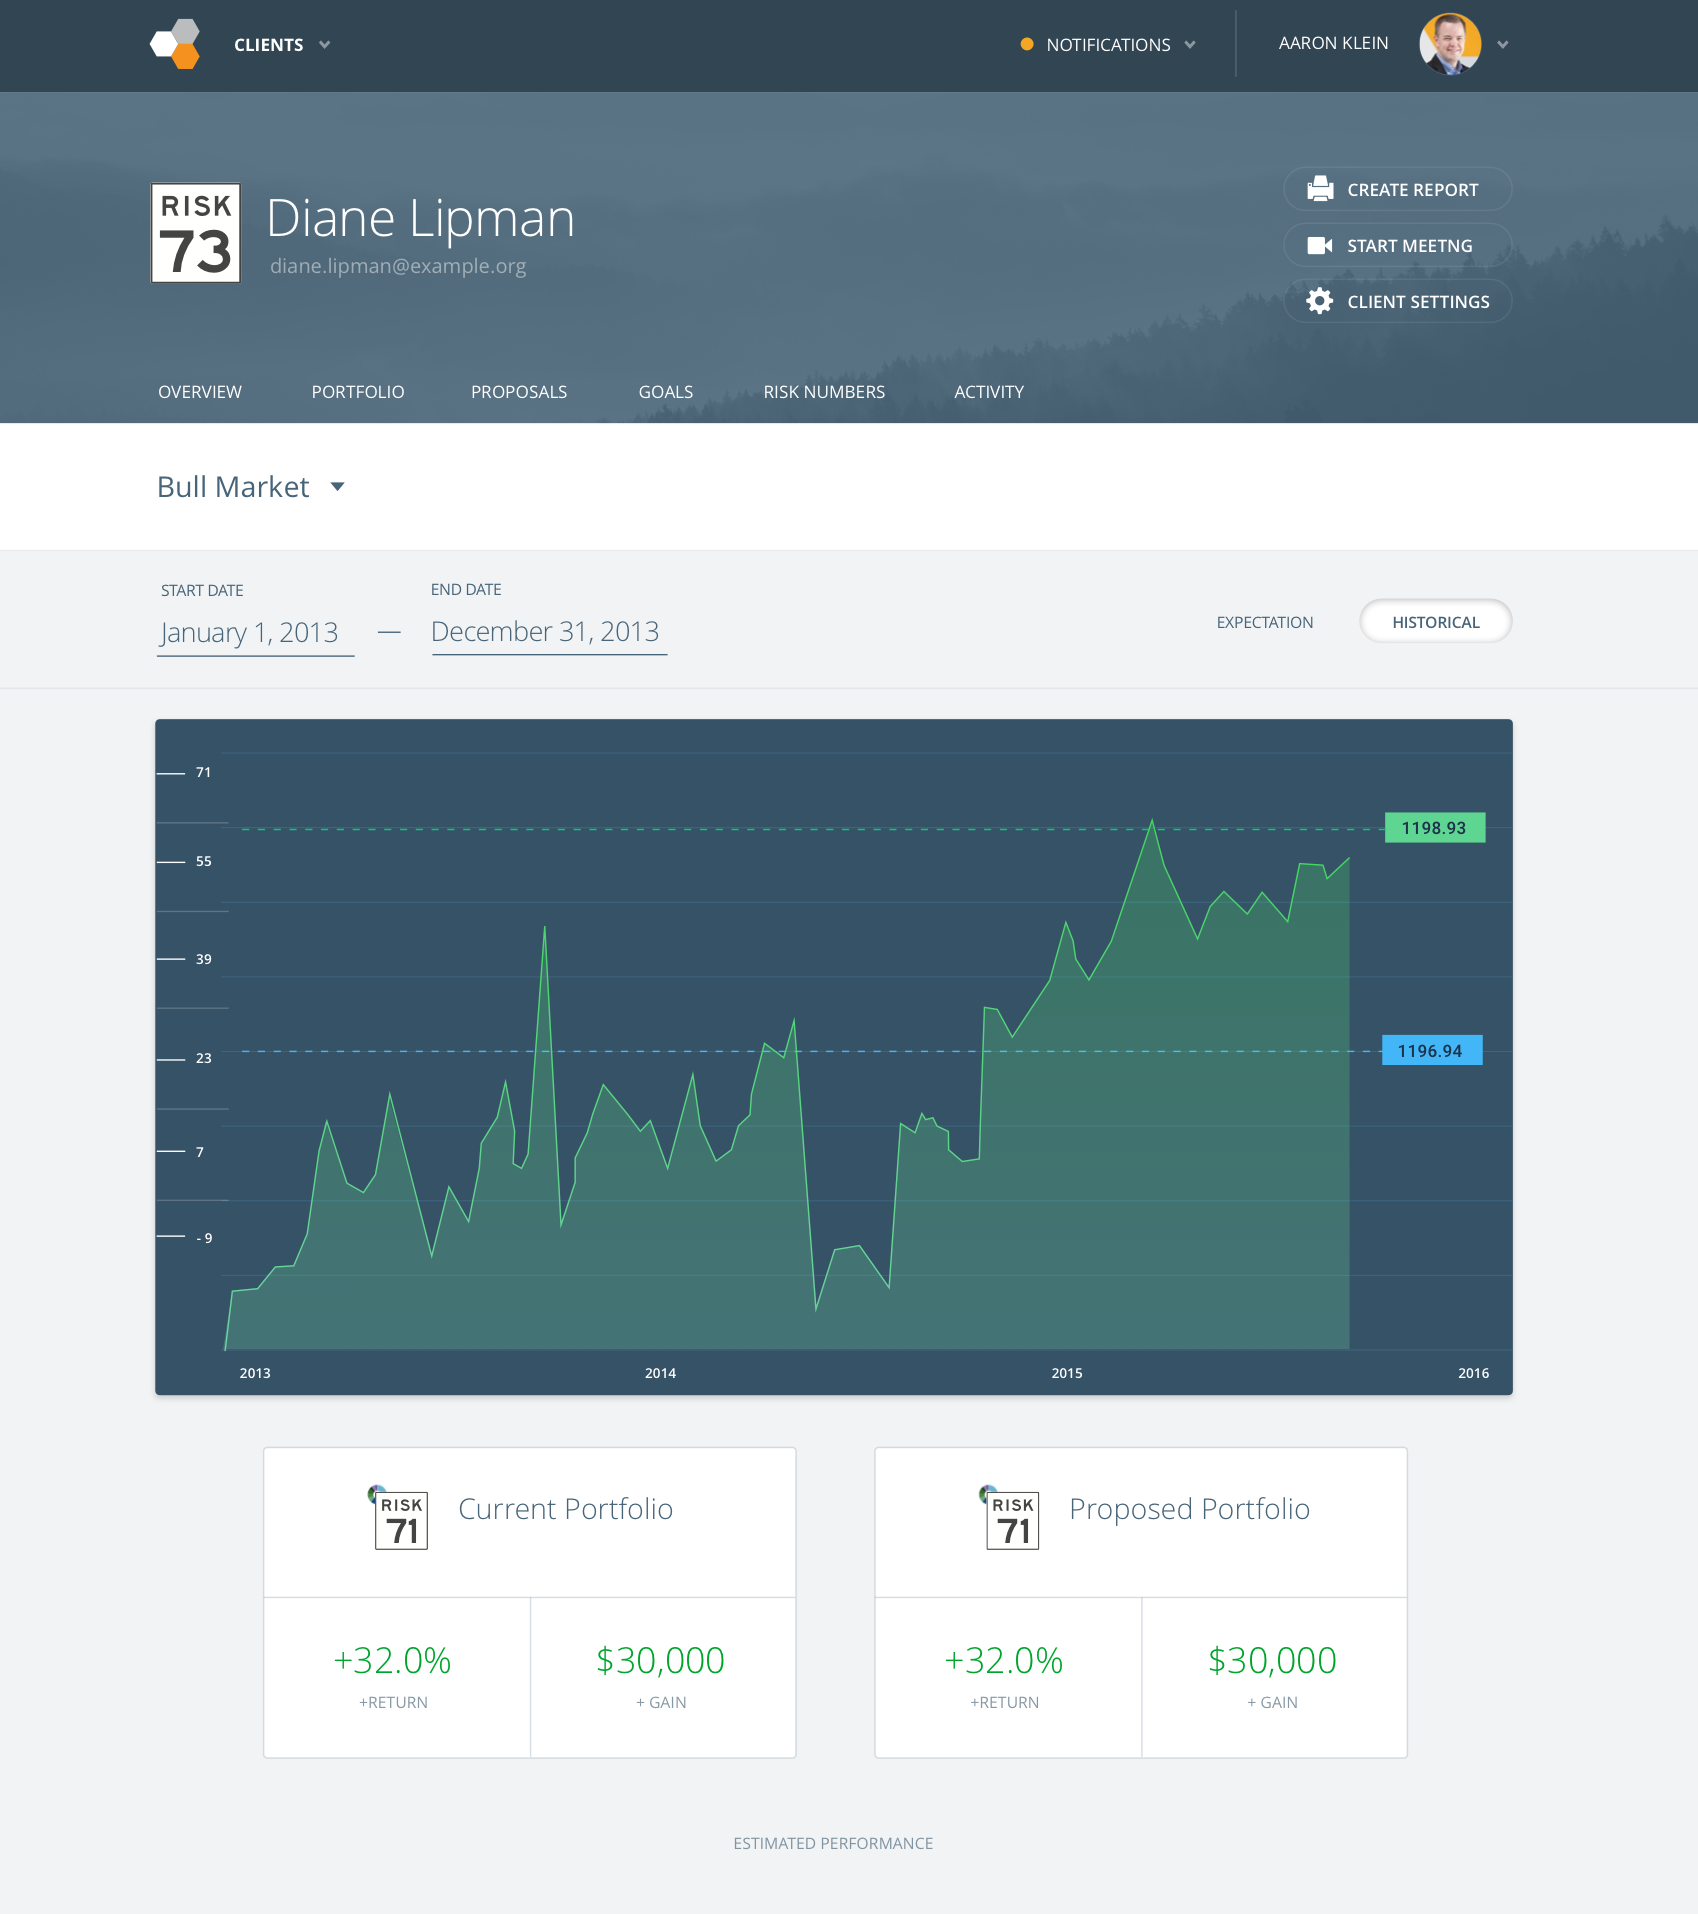
We really struggled with that this dynamic chart really work in our current layout for the client section of the application. We ended up settling on a full screen modal where sceanrios could shine on it's own without any distraction. This feature was really intended to be used with a client in meetings so we wanted it to have the wow factor for the advisor.
Prototype: https://invis.io/XJHPHW1BEV6#/294215708_1e